In 2017 we took over the Google Ads account of a Dutch dental group with two locations — general dental care plus its own dental-prosthetics lab and surgery. The brief was familiar: cost per new patient too high, conversion volume too low. The fix took about nine months. The engagement then ran another four and a half years, with cost per patient holding steady through every seasonal swing.
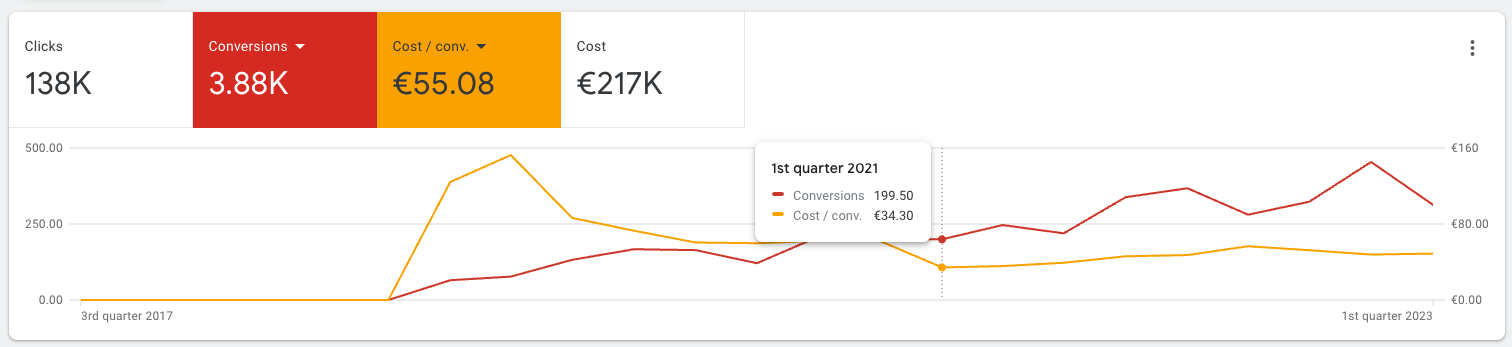
Two lines, five and a half years. The yellow cost-per-conversion line spikes hard at the end of 2018 (the inherited account at its broken peak), then drops below €80 during the nine-month rebuild and stays there. The red conversion-volume line climbs through 2020 and holds in the 250–450 per quarter band through 2022. Q1 2021 is the best quarter on the chart: 199 conversions at €34.30 per patient.
What we did: three small moves in nine months, then four years of holding the line
The inherited campaigns ran on broad geographic targeting around both clinic locations — including overlap zones where neither clinic was the natural choice for a prospective patient. We tightened the targeting to each clinic’s real catchment radius, split the two locations into separate campaign clusters, and let each one bid on its own audience instead of cannibalising the other.
Same monthly investment from the client. Different return — because the spend went to the place that could actually do something with it.
With a clean separation between the two clinics, the imbalance became clear: one converted at meaningfully lower cost than the other while they spent the same. We shifted the budget proportionally — capping the weaker-performing clinic at a level that matched its sustainable conversion rate, and freeing up budget so the stronger performer could scale.
Money away from the underperformer, toward what actually worked.
With budget flowing to where it converted, the ads in those higher-priority clusters had to earn it too. We rewrote ad copy around service-specific intent — separating general-dental-care searches from cosmetic and implant searches, and matching the ad language to what each searcher was actually looking for. Quality Score followed, and so did cost-per-click.
By month nine, cost per new patient averaged €47.81 across both locations, with the best months at €35. Quarterly conversion volume went from 200 to 300. From that point the work shifted to maintenance — quarterly reviews, seasonal copy refreshes, the occasional budget rebalance when catchment areas shifted. The blended €55 cost per conversion across the full 5.5-year engagement reflects the boring middle: long stretches of “nothing dramatic happened,” which is exactly the point.
By month nine, cost per new patient averaged €47.81 across both locations, with the best months at €35.
By the numbers
The turning-point figures from the nine months are the visible high point: from a €65 baseline to a €47.81 average, €35 best month, conversion volume from 200 to 300 per quarter. The more interesting number is what came after — another four and a half years of holding that band, with €217K in total spend converting at a blended €55.08 across the whole engagement.
Cost per new patient, before and after. Inherited baseline to the state after nine months.
The best clients aren’t the rescue stories. They’re the ones who stopped needing rescuing four years ago.
Boring, predictable, attributable. That’s what good PPC looks like.
Every engagement starts with a 30-minute audit — free, no slides, just a screen-share through your account.
Book the audit →